The GOAT Index is a single number meant to answer “who’s the best performer at this race for a given time period?” — combining how fast you were for your age, how well you placed, and how many years you’ve shown up. It’s built from three components that add up to 100:
Speed Score — up to 50 points
Dominance Score — up to 30 points
Participation Score — up to 20 points
1. Speed Score (up to 50 points) — “How fast were you?”
Raw finish times aren’t equivalent across age and gender — a 50-year-old running 22:00 might be a far more impressive 5K than a 22-year-old running 19:00. So instead of comparing raw times, we use age-graded percentage: your time compared to the world-class standard for someone your exact age and gender. A higher percentage means you’re closer to “world-class for your age.”
The Speed Score takes your average age-graded % across all your races, then scales it so the single best average performer in the field gets the full 50 points, and everyone else gets a proportional share.
speed score = (your avg age-graded %) ÷ (best avg age-graded % in the field) × 50Worked example — Runner A: Runner A averaged a 58.62% age-graded performance across 5 years of racing. The top average in the field belongs to Runner B at 69.62%. So Runner A’s Speed Score is:
58.62 ÷ 69.62 × 50 = 42.10 / 50
How “Age-Graded Percentage” Actually Works
A 19:22 means something very different for a 22-year-old than it does for a 62-year-old. Age grading solves this by converting every finish time into a single, comparable percentage: “how close was this performance to the best a human of this exact age and gender could realistically run?”
The standard: For every age (5 to 100) and gender, there’s a “standard” 5K time — roughly the world-class benchmark for that age/gender. These come from the Alan Jones 2025 Road Running Standards, a widely-used reference table in masters and age-group running, approved by USATF’s Masters Long Distance Running Council in January 2025.
The formula:
age-graded % = (standard time for your age & gender) / (your actual time) × 100A result near 100% would be an all-time-great, essentially world-record-level run for that age and gender. 80%+ is considered “national class” — exceptional for a local 5K.
Worked example — a 62-year-old man running 19:22 (83.56%): The standard 5K time for a 62-year-old man is 16:11 (971 seconds). He actually ran 19:22 (1,162 seconds).
971 ÷ 1,162 × 100 = 83.56%
A 19-year-old’s outright race win could easily be several minutes faster in raw time than this 62-year-old’s 19:22 — and still end up with a lower age-graded percentage, if that raw time isn’t as close to what’s possible at 19 as 83.56% is to what’s possible at 62. That’s the whole point of age grading — it lets a 62-year-old’s “slow” time and a much younger runner’s race-winning time be compared on a level playing field, and sometimes the older runner wins that comparison.
Runners who’ve raced multiple years have their age-graded percentages averaged for the Speed Score.
2. Dominance Score (up to 30 points) — “How close to the front were you?”
This score throws out time entirely and asks one question: what percentage of the field did you beat? It converts your finishing position into a 0–100% scale where 1st place = 100% and last place = 0%, with everyone else falling in between based on where they landed in the pack.
The formula:
dominance = 1 - (finish_position - 1) / (field_size - 1)1st place: 1 - (1-1)/(field_size-1) = 1.0 (100%)
Last place: 1 - (field_size-1)/(field_size-1) = 0.0 (0%)
Dead middle of a 300-person field (150th): 1 - 149/299 ≈ 0.50 (50%)
This is multiplied by 30 to get a per-race score out of 30 points, then your overall Dominance Score is the average across all your races.
Why percentile instead of raw position? Field size changes from year to year, so “23rd place” means something different depending on how many people showed up. Converting to a percentage of the field beaten makes every year directly comparable — finishing 23rd out of 538 is roughly the same accomplishment as finishing 14th out of 318.
Worked example — Runner A:
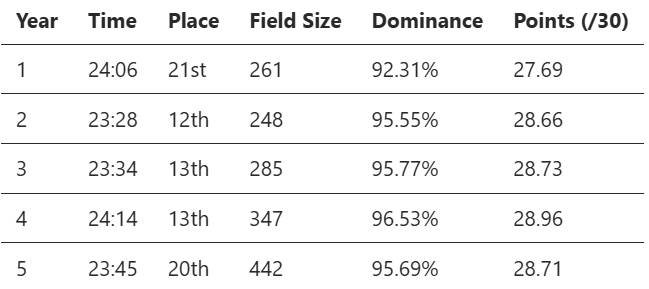
Average dominance across these 5 races: 95.17% → Dominance Score = 28.55 / 30.
Notice that even Runner A’s “worst” year (Year 1, 21st place) was still a top-9% finish — which is why the Dominance Score stays consistently near the max. This is also why Dominance and Speed scores can diverge for the same runner: the age-graded % (58.62%) reflects how the runner compares to the theoretical best for their age, while the Dominance score (95.17%) reflects how they compare to the actual people who showed up that day — and in this case, the runner was consistently near the very front of that pack.
3. Participation Score (up to 20 points) — “How many years did you show up?”
This one’s the simplest of the three: you get points for every year you raced, scaled up to the full 20 points for racing in every year covered by the dataset.
participation score = (years raced / total years in dataset) × 20For a 5-year dataset, that works out to:
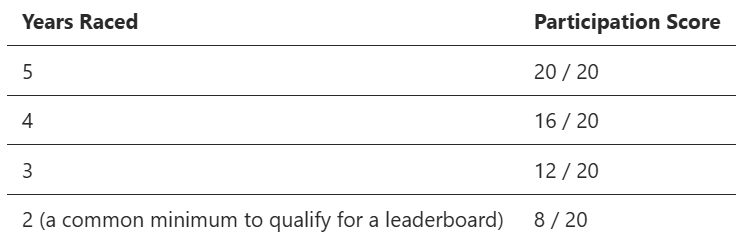
That’s it — no math beyond counting. It exists because the GOAT Index is meant to celebrate the race’s regulars, not just someone who happened to run one blistering 5K and never came back.
Putting It Together
GOAT Index = Speed (50) + Dominance (30) + Participation (20), for a maximum of 100. Ties are broken first by total appearances, then by single best age-graded performance.
This is a speed-leaning formula — half the score comes from how fast you were for your age, with dominance and longevity splitting the rest. That means a runner with a blistering average pace and only a couple of appearances can still outscore a longtime regular with a more modest pace.
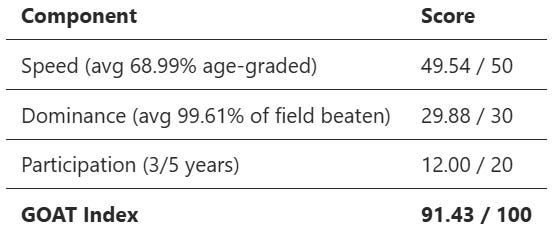
Full example — Runner C (a runner with a hot streak):
Full example — Runner A (a longtime regular):
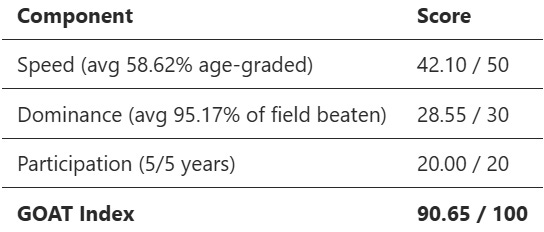
This pairing shows the formula in action: Runner C, with only 3 appearances, gives up 8 of the 20 participation points — but near-perfect speed and dominance scores are enough to edge out Runner A, who raced every year (a full 20/20 on participation) but at a more modest pace. It’s a near-perfect illustration of the formula’s central tradeoff: a few years of blistering pace vs. steady excellence over the long haul.