Gulf Coast Marathon Weather Profile
Historical analysis across the past five years
The Gulf Coast Marathon takes place in early December along the Mississippi Gulf Coast, a time when the region transitions from fall into mild winter. Gulfport, MS and surround areas typically experience December temperatures ranging from the upper 40s to low 60s°F, with occasional cold fronts pushing conditions into the 40s and rare warm days climbing into the 70s. Humidity remains moderate compared to summer months, and the coast sees occasional rain but generally avoids the extreme heat that challenges summer marathoners. However, this seemingly mild window masks significant year-to-year variability—as our historical data reveals, Gulf Coast race conditions have ranged from crisp 47°F mornings to surprisingly warm 72°F afternoons. Understanding these patterns is essential because even small temperature swings impact pacing strategy and performance. In this section, we’ll examine five years of actual race-day weather observations to show you what conditions runners have faced, how they’ve varied, and how to build a flexible race strategy that prepares you for whatever December brings.
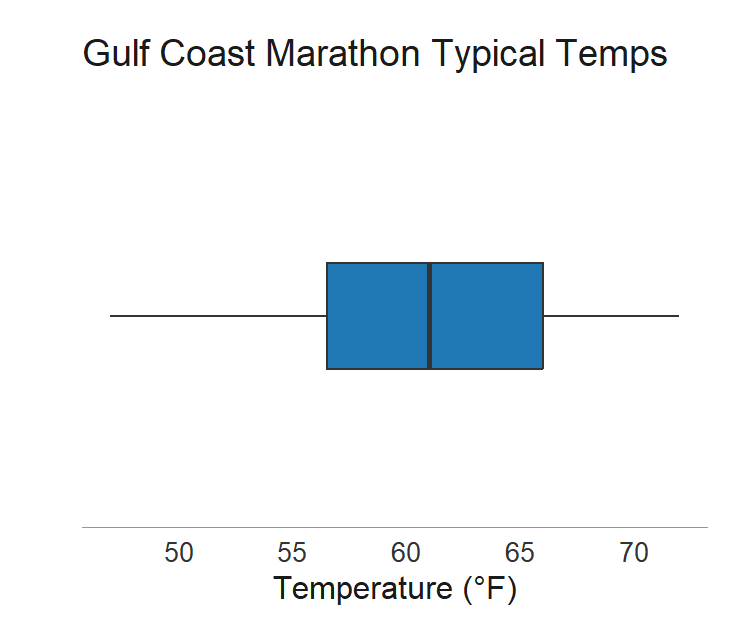
Across all Gulf Coast Marathon races in our dataset, temperature observations averaged 60.4°F with a median of 61°F. Conditions ranged from a low of 47°F to a high of 72°F, showing the significant variability runners face—a 25-degree spread. The standard deviation of 7.2°F indicates most temperatures clustered between 53°F and 67°F (one standard deviation from the mean). Half of all observations fell between 56.5°F and 66°F, representing the typical race-day window runners should prepare for.
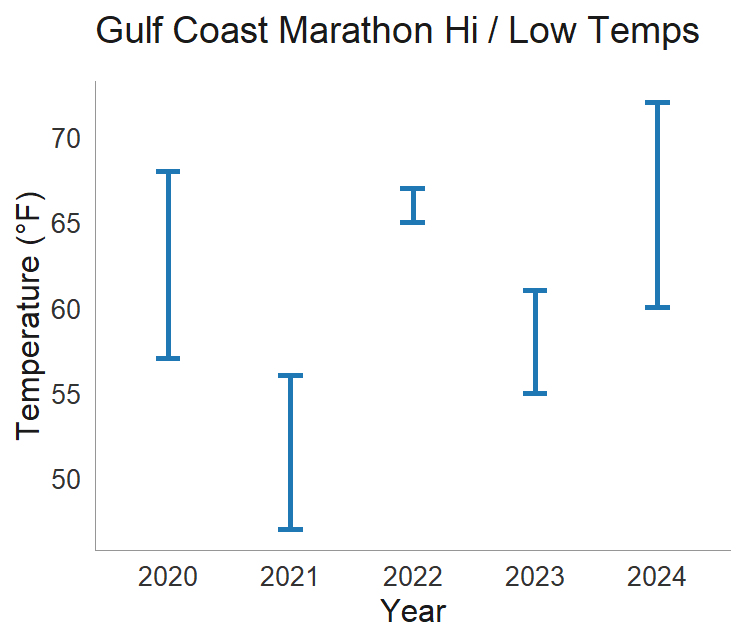
Most running research suggests the ideal marathon temperature falls between 44°F and 59°F—cool enough to manage heat but warm enough to avoid excessive cold stress. Gulf Coast’s average of 60.4°F runs just above this optimal window, pushing the race into the heat-management zone for most runners. While some years dip into the ideal range with lows around 47°F, most race conditions trend warmer, with temperatures frequently climbing into the 65–72°F range where performance penalties accelerate. This consistent drift above the ideal threshold is precisely why Gulf Coast demands a weather-focused pacing strategy. As seen below, only two years saw race temps within the ideal range.
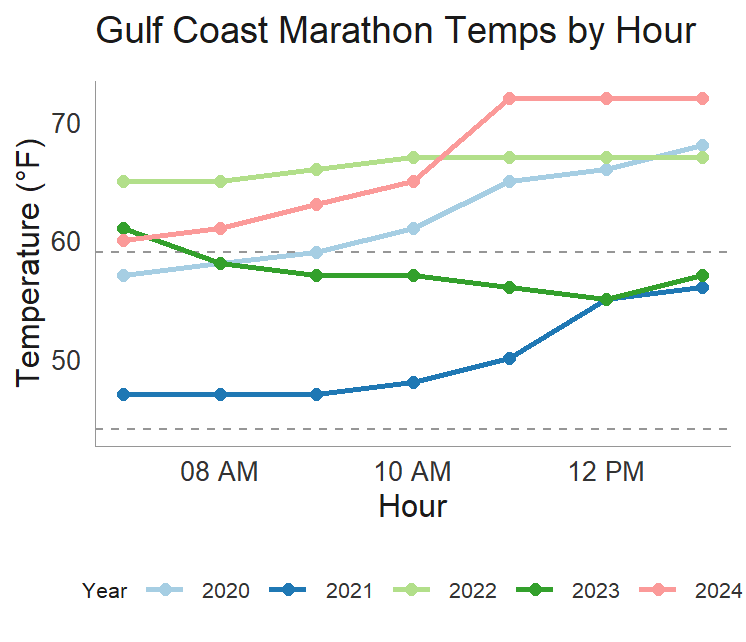
Temperature changes throughout the race day impact your performance. If conditions warm from morning to afternoon—which happens frequently at Gulf Coast—your body must continuously adapt to increasing heat stress. This dynamic warming is harder to manage than steady conditions because your pacing strategy becomes less predictable. Understanding how temperature will shift across the hours you’ll be racing allows you to anticipate when conditions will be most challenging and adjust your effort accordingly.
December generally features winds predominantly from the north, with average speeds around 7-9 mph. Runners are heading generally eastward/southeast from Pass Christian to Biloxi along the coast. If winds are from the north/northeast (typical for early December), runners would be experiencing a crosswind or slight headwind for much of the race depending on the exact course routing along Highway 90.
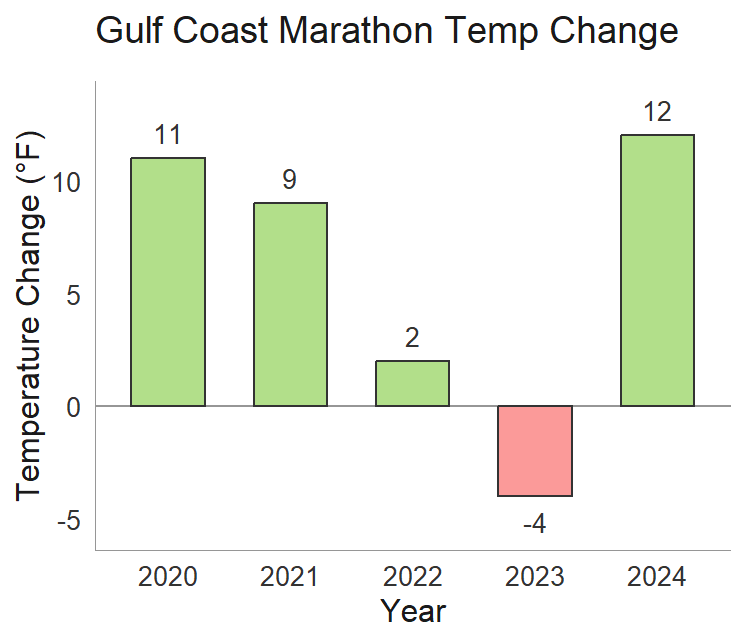
Understanding Gulf Coast Marathon’s weather patterns—temperature ranges, hourly warming trends, and wind conditions—transforms how you approach race day. The data shows you’ll likely start in the high 40s to low 50s and warm into the 60s-70s by mid-race, with most years experiencing 9-12°F of warming from start to finish. Add in the typical north/northeast winds creating a crosswind or headwind along the eastward coastal route, and you have a recipe that demands strategic pacing. Your training prepared you for the distance—now let the weather data prepare you for the conditions you’ll actually face.
Now that we understand Gulf Coast’s weather patterns, the next question becomes: how do these conditions actually impact different runners? Gender, age, and fitness level all influence how temperature affects your performance. In our next analysis, we’ll examine exactly how weather impacts finish times across demographic groups so you can build a personalized race strategy.