Gulf Coast Marathon by the Numbers
What the last five years reveal about race participation and performance
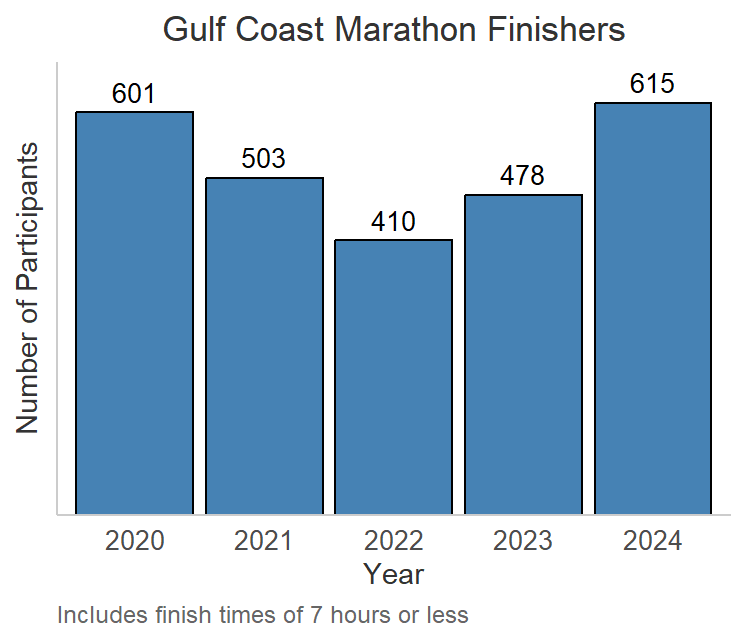
The Gulf Coast Marathon has drawn thousands of runners to the Mississippi Gulf Coast over the years, offering a flat, fast course along scenic coastal routes. With marathon participation ranging from 410 to 615 finishers annually over the past 5 years (2020-2024), the race attracts a diverse field of runners—from first-time marathoners to seasoned competitors chasing personal records.
Here’s the registration link if you are interested in participating: Keesler Federal Mississippi Gulf Coast Marathon.
In this analysis, we’ll break down the data across four key areas. First, we’ll examine participation trends over the past five years. Then we’ll dive into finish times, showing you when most runners finish. Next, we’ll explore the weather patterns that define Gulf Coast race days and understand how conditions have varied year to year. Finally, we’ll connect all of this together with practical pacing suggestions based on forecasted weather, so you can build a race strategy that accounts for the conditions you’re likely to face.
Regarding participation trends, the race has an average of 504 finishers under 7 hours with a range of 410 to 615 total runners.
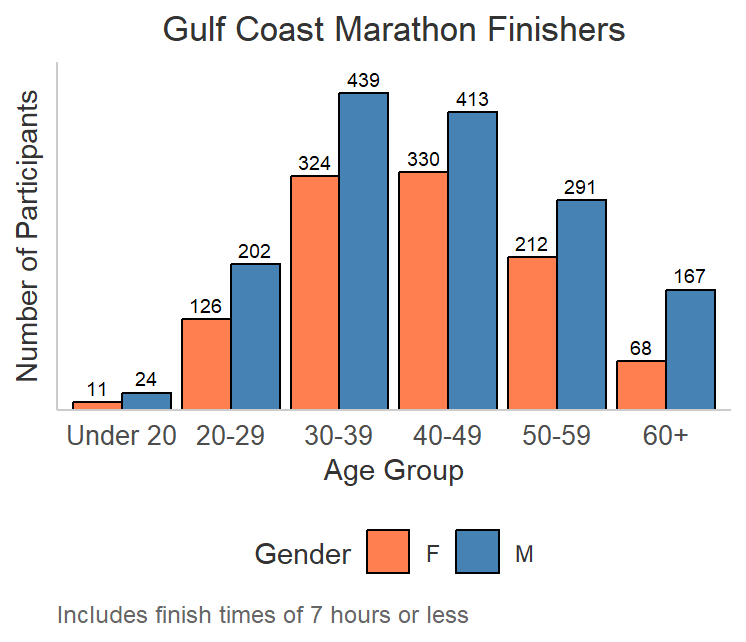
Most runners are between 30 and 50 years old.
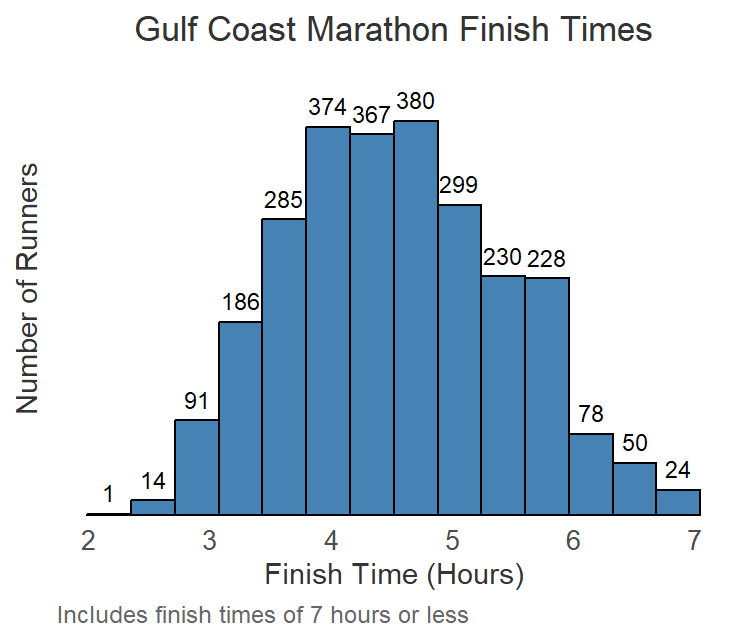
Gulf Coast finishers cluster between 3:52 and 5:10 (the middle 50%), with a median finish of 4:30. The tight distribution around the 4–5 hour range reflects the race’s fast, flat course and attracts runners seeking achievable but competitive times. Elite finishers dip below 2:20 while the slowest exceed 7 hours, but most runners aim for that sweet spot of 4.5 hours.
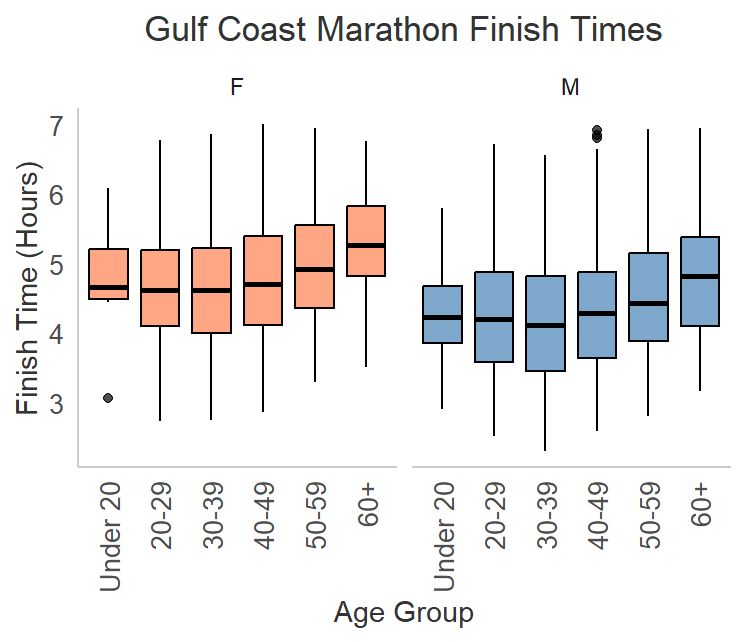
Male finishers average 4:22 (median 4:18) while female finishers average 4:47 (median 4:45)—a 25-minute difference that mirrors typical marathon gender performance gaps. Statistical analysis confirms the gender gap in finish times is highly significant (p < 0.001), with females finishing 21–29 minutes slower on average than males. This will factor into the analysis of how weather impacts finish times.
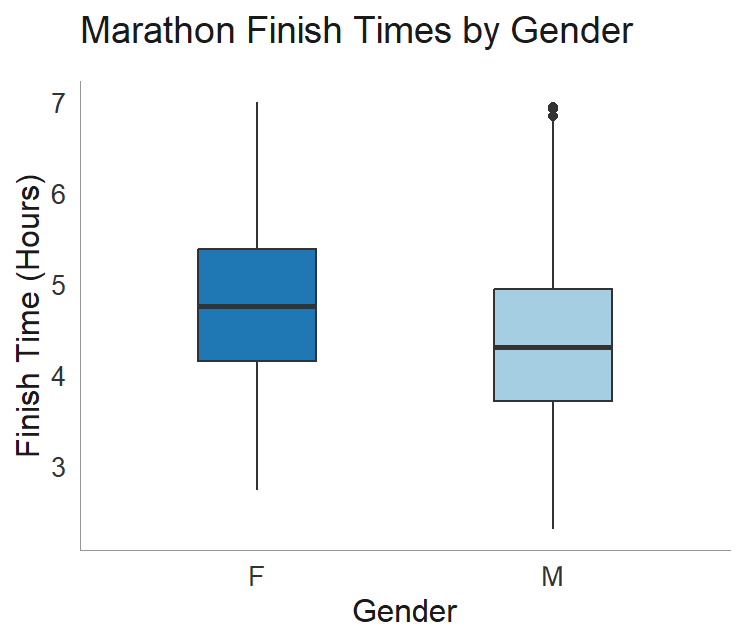
Each box shows where most runners in that gender group finished. The line in the middle of each box is the median—the halfway point where 50% finished faster and 50% finished slower. The top and bottom edges of the box represent the 25th and 75th percentiles, meaning the box contains the middle 50% of all finishers. The thin lines extending above and below the box show the typical range of times, while the dots represent outliers—unusually fast or slow finishers who fall well outside the normal pattern.
Age group is also a driver of finish time. Across both genders, there’s a clear aging effect: runners aged 20-39 finish fastest, performance plateaus in the 40s, then slows noticeably in the 50s and 60s. Female runners aged 20-39 average 4:38-4:39, dropping to 4:56 in the 50s and 5:19 at 60+—a 40-minute spread. Male runners show a similar pattern: ages 20-39 average 4:15-4:16, increasing to 4:32 in the 50s and 4:49 at 60+—roughly a 35-minute spread. Statistical analysis confirms age is highly significant (p < 0.001).
So what emerges from this data? Gulf Coast attracts runners primarily between ages 30-50 who are capable of finishing in the competitive 4-5 hour window. Gender and age are both strong predictors of finish time, with roughly a 25-minute male advantage and a 35-40 minute spread between the youngest and oldest runners. These baseline patterns give us a framework for race planning, but here’s where weather becomes critical: these demographic and age-related patterns tell us only part of the story. The real variable that shifts finish times unpredictably from year to year is weather. Temperature, humidity, and wind don’t care about your gender or age—they impact every runner. In the next section, we’ll examine Gulf Coast’s weather history and discover how conditions have impacted performance over the years to help build personalized pacing strategies that account for the forecast you’re actually facing on race day.